Advanced options dialog box
This topic describes the purpose of the Advanced options dialog box and all the settings and buttons on it.
The Advanced options dialog box allows you to set:
- The number of rows that appear on each page on the Data view.
- Whether or not your analysis uses data calls from the CDR.
- Whether or not terminating towers are selected on the map and Sector data tab when a call is selected where the originating and terminating towers are different.
- Whether or not the Real time smart-track dialog box appears when new live ping data has arrived for the case.
- The printable map size.
- The default settings of the size of the sector beam widths and radiuses when they are initially displayed on the map. Your system administrator can set the initial default settings for all OSS-ESPA users but the Advanced options dialog box allows you to override these default values with your own.
- The appearance of sectors such as only displaying them partially filled and the transparency of the sector's color.
- How the target location and tower pop-ups are displayed on the map.
- The configuration of the call and geo-location analyses. The different analyses have different configuration settings available, however an example of one which is applicable to a multiple analyses is the number of items you want to include in your results.
- Whether or not the estimated call location, TA arc, and handover map layers are displayed.
- The appearance of the estimated call location and TA arc such as the size and transparency level.
- Which analyses are run when the case is refreshed.
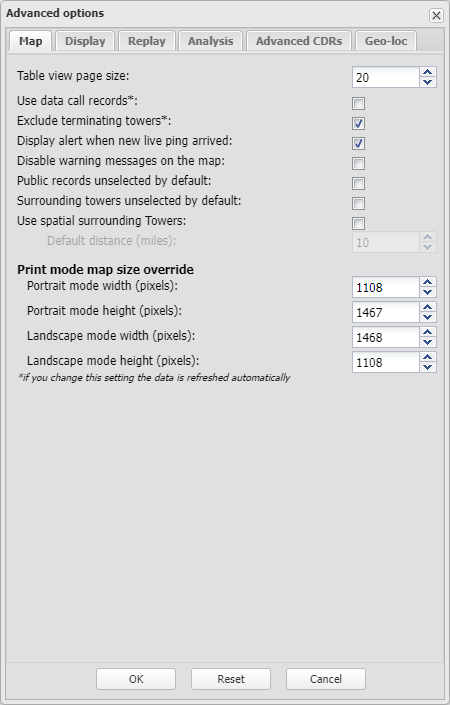
Select the number of rows you want displayed on the Data view, such as the CDR data tab and Sector data tab, which is located at the bottom of the ESPA analysis center screen. The default value is 20 rows and the maximum value is 500 rows. This setting does affect the performance of the ESPA analysis center due to browser limitations. If you are using Google Chrome then the ESPA analysis center performance is slower when you increase the number of rows. For optimal performance it is recommended you set a value between 20 and 50 rows.
Select if you want to include data calls, including some Timing Advance records, in your analysis. By default this is selected as T-Mobile timing advance records often classify some of their calls as data and if this was not selected then the CDR data tab would not include these useful calls. However, typically an analysis for most CDR file types is done using only voice and SMS calls and not data calls. This is because data calls may not provide accurate location information. If you select to include data calls they are displayed on the CDR data tab using an orange row.
NOTE: If you change this setting the data is refreshed automatically.
Select if you want to exclude terminating cells from automatically being selected on the map and Sector data tab when a call is selected where the originating and terminating towers are different. Also, when this is selected, the Usage column on the Sector data tab does not include the terminating calls in its count.
This setting is selected by default as it is more common to only view the originating sectors and it is easier to see these when the terminating sectors are automatically excluded.
NOTE: If you change this setting the data is refreshed automatically.
Select if you want the Real time smart-track dialog box to display immediately when new live ping data arrives for the case. If this setting is not selected then you are only notified of the new ping data when you click Refresh or Refresh data or perform any other change on the ESPA analysis center screen that causes the screen to refresh.
Select if you want to stop the warning messages from displaying on the map. Normally you will want these to display, however you may want to disable them when you are replaying narratives or taking screen captures of the map.
Select if you do not want to display the public record details on the map by default. This is useful if you prefer to validate the record before displaying it. It is also useful if there are lots of records, as having them all display by default can make the map cluttered.
Select if you do not want the surrounding towers displayed by default. This helps improve the performance when you initially load a case. Surrounding towers can also be manually displayed in the case after it has loaded.
Select if you want to plot the surrounding cell towers from the spatial area and then choose the range in miles. This plots surrounding cell towers from the spatial area with the initial and last information within the range of the time period.
NOTE: By default, even if Use spatial surrounding towers is unselected, the surrounding towers within 3 miles are displayed.
Select the range to be used in Use spatial surrounding towers. The default distance is 10 miles, however you can select a range from 1 miles to 30 miles.
Select only if you need to edit the default portrait print width. This setting is used when you are printing a map from the ESPA analysis center screen. For further information refer to Printing the map view.
Select only if you need to edit the default portrait print height. This setting is used when you are printing a map from the ESPA analysis center screen. For further information refer to Printing the map view.
Select only if you need to edit the default landscape print width. This setting is used when you are printing a map from the ESPA analysis center screen. For further information refer to Printing the map view.
Select only if you need to edit the default landscape print height. This setting is used when you are printing a map from the ESPA analysis center screen. For further information refer to Printing the map view.
Click to apply any changes you have made. The dialog box closes automatically. Note, any changes to Exclude terminating towers requires you to click Refresh or Refresh data before the change takes effect.
Click to reset all the default settings specified by your system administrator. This resets all the settings on all tabs.
Click to close the dialog box without applying any changes you may have made.

Select if you want to use the default value displayed when a case is opened on the ESPA analysis center. If this default is not selected then the value set in the cell tower database is used for each sector.
For HO data, if this setting is not selected and there is a beam width value displayed on the HO data tab then that value is used, otherwise the Default beam width (degrees) value is used. This is useful when you are preparing court reports as the handover cell tower appears similar to the originating cell tower which simplifies the report.
Select the sector beam width you want used as the default each time a case is opened on the ESPA analysis center. The default value is 120 degrees.
Select if you want to use the default value displayed when a case is opened on the ESPA analysis center. If this default is not selected then the value set in the cell tower database is used for each sector.
Select the sector radius you want used as the default each time a case is opened on the ESPA analysis center. The default value is 1.24 miles.
Select if you want to display the sectors as open sectors where they are only 20% partially filled. You may want to do this so that you are not showing an exact theoretical cell boundary in your report. Showing an exact theoretical cell boundary could cause people to incorrectly believe that the cell coverage ends exactly where the displayed theoretical pie cell boundary ends.
Select if you want to display all the sectors from the cell tower data file on the map regardless of whether a call is selected on the CDR data tab.
When this setting is selected:
- All sectors are displayed on the map regardless of whether calls made from these sectors are selected.
- Sectors without any calls selected are is displayed on the map as an outline with no transparency effect.
- Sectors with one or more calls selected are displayed on the map as an outline with a transparency effect.
When this setting is not selected:
- Any sector that was not used during a selected call is completely removed from the map, including the sector outline and any interactivity with the sector.
Use the slider to change the transparency of the sectors displayed on the map. Reducing the transparency level is useful if you have multiple sectors overlapping each other as it makes it easier to read the underlying map layers and street names.
Select if you want to display the sector information in a format which allows you to open multiple pop-ups and move them around the map. This gives you the flexibility to position it on an area of the map that you want to view which would otherwise be hidden by the default target location pop-up, and to include it on map views in advanced analysis reports. It also allows you to open the sector information by simply left-clicking a sector.
Select if you want to display the target location information in a format which allows you to move the pop-up around the map. This gives you the flexibility to position it on an area of the map that you want to view which would otherwise be hidden by the default target location pop-up. All the target location information is displayed including the detailed description, however the pop-up is scalable so you can also size it to not display the detailed description if required.
This setting is only available if Show draggable pop-ups without call-out is selected. Select if you want to display the target location pop-up with a transparent background. This gives you the flexibility to view the area of the map immediately under the pop-up that would otherwise be hidden.
Select to display only the target location description in the target location information pop-up. You may want to select this if you are adding notes to an advanced analysis report. For further information refer to To annotate your map view with notes.
Click Font to edit how the call information is displayed in the tower reference and TA arc pop-ups. The Call information font dialog box opens.
Click Change to edit which call information you want displayed in the tower reference, geo-location, TA and Handover pop-ups . The Call/Geo-Loc information columns dialog box opens.
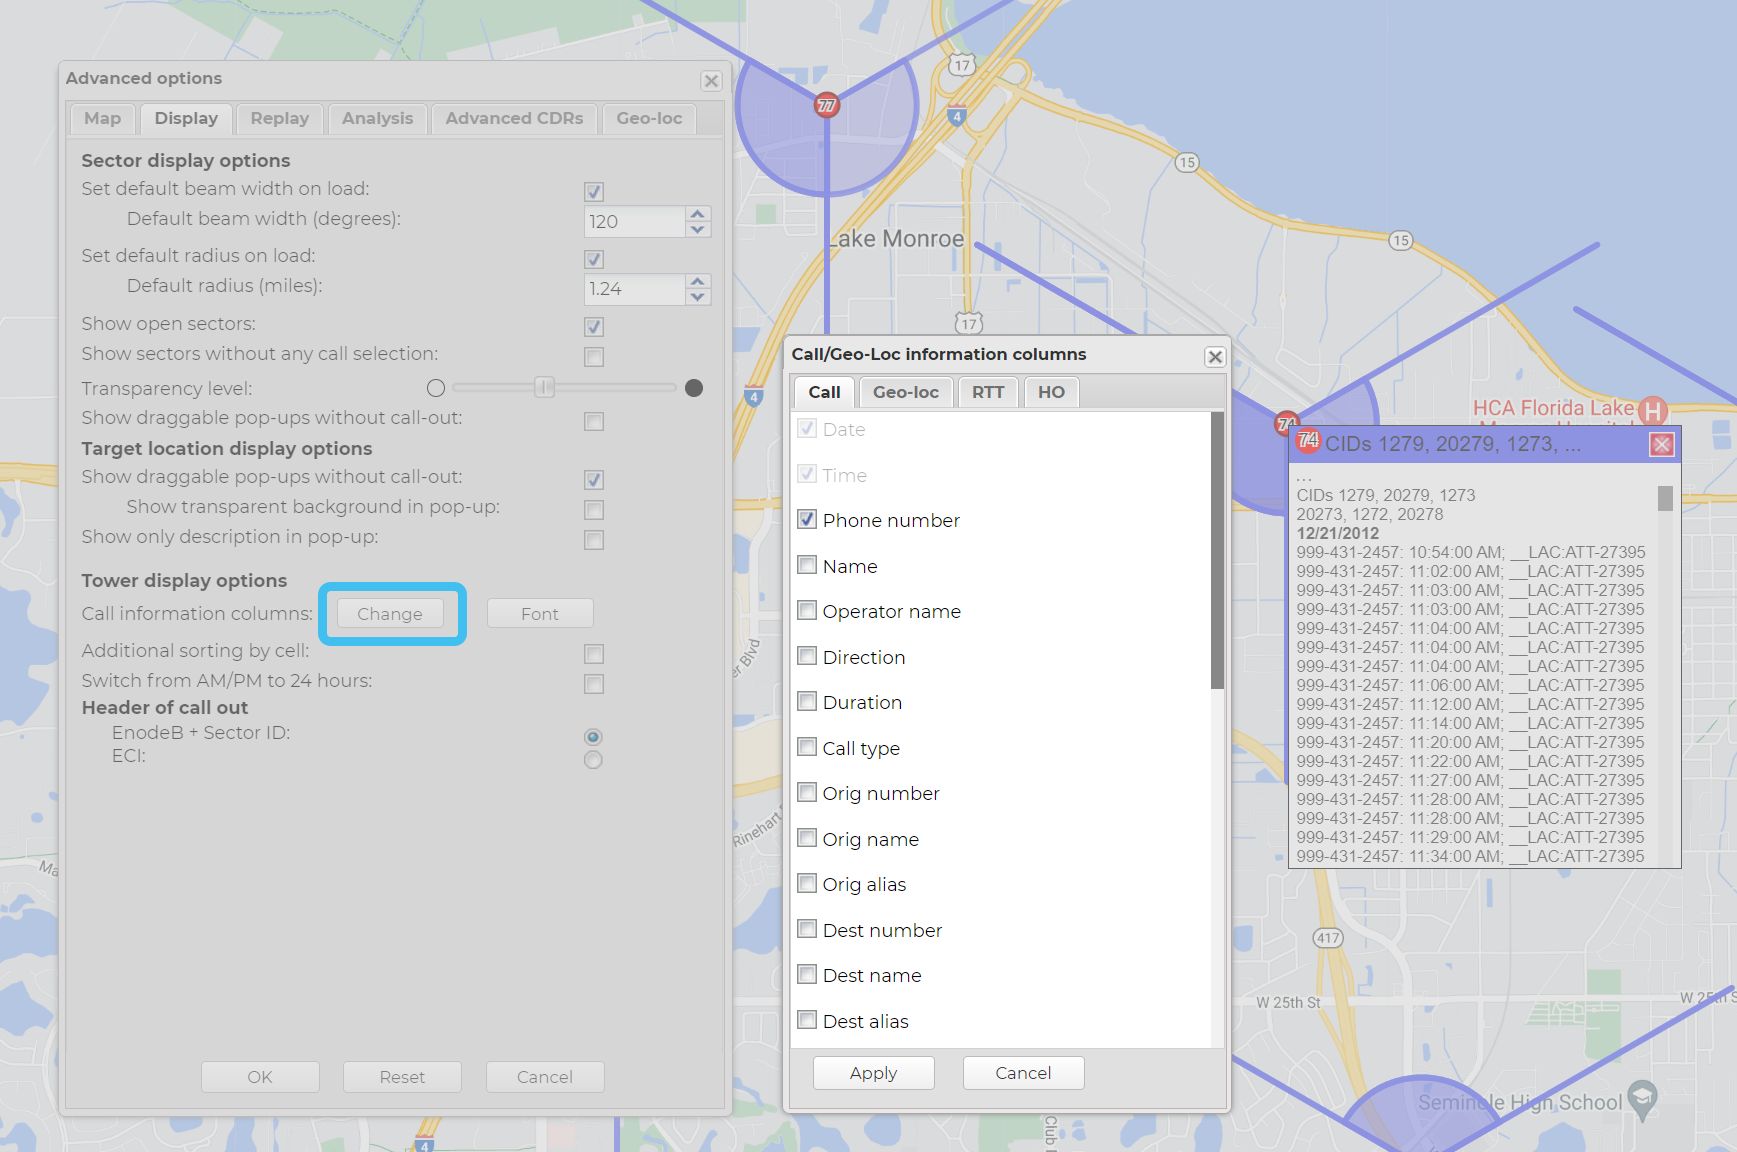
Select if you want to display the details in the tower reference pop-up by cell then date/time. If this is not selected the details are displayed by date/time.
Select if you want to display the time in the tower reference pop-up using the 24 hour format rather than the AM/PM format. If this is not selected the time is displayed as AM/PM.
Select whether or not the LTE tower pop-up displays either the EnodeB and Sector ID, or the ECI.
Select if you want to load the global locations so that you can display them on the map. Click Change to open the Location type window which allows you to select which types of global locations you want loaded.
Select whether or not the global locations map layer is displayed when the map is loaded.
Click Change to open the Location type window which allows you to select which types of global locations you want loaded onto the map when Show global location layer on the map is selected.
Click to apply any changes you have made. The dialog box closes automatically.
Click to reset all the default settings specified by your system administrator. This resets all the settings on all tabs.
Click to close the dialog box without applying any changes you may have made.
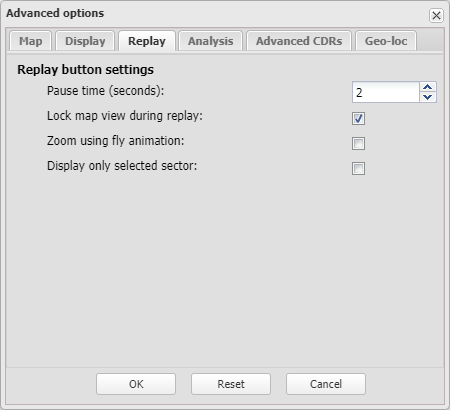
Set the time interval between the changing of the records on the replay feature. The replay feature is available on the CDR data, Timeline and HO data tabs. For further information refer to Replay and Replaying movements on a tab.
By default this is selected which means the map location and zoom remains the same as you have them currently selected on the map throughout the replay. This is the normal setting, however if you want OSS-ESPA to determine the zoom setting you must clear this setting.
Select if you want to add animation to the replay where the screen zooms in and out when it changes location.
If this setting is:
-
not selected, then all the sectors are displayed and stepped through and highlighted, with a black outline, one at a time on the map.
-
selected then only one sector is displayed at a time and it is highlighted with a black outline on the map.
Click to apply any changes you have made. The dialog box closes automatically.
Click to reset all the default settings specified by your system administrator. This resets all the settings on all tabs.
Click to close the dialog box without applying any changes you may have made.
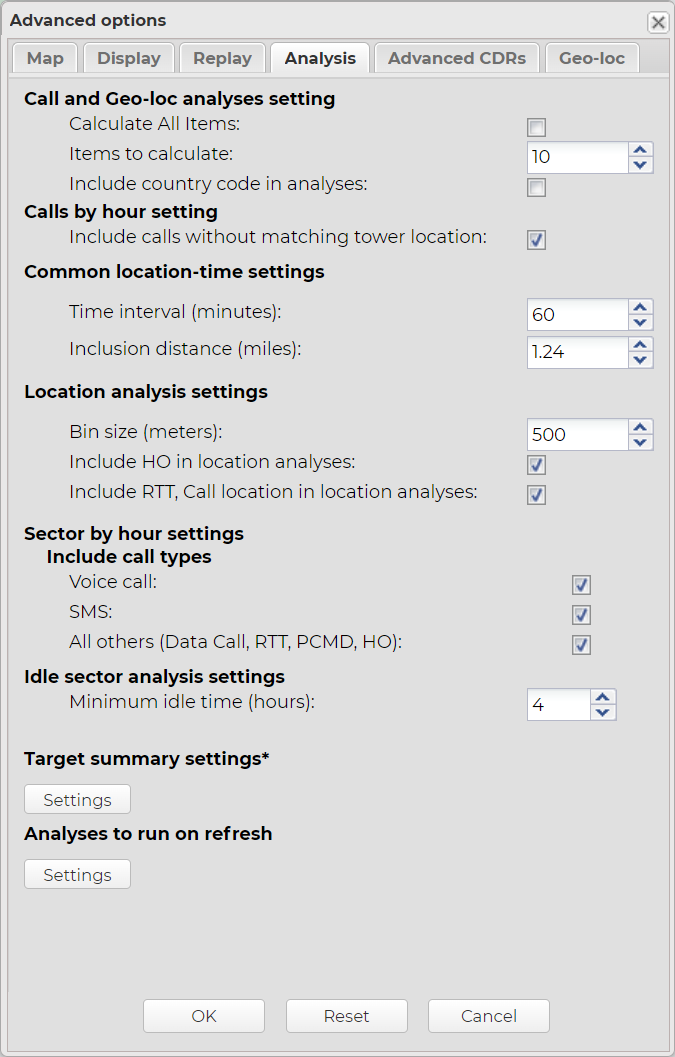
Select to display all of the results for the following analyses:
- Call analyses: Frequent numbers, Frequent sectors, First-Last sectors, Sector by hour, Common numbers and Idle sectors.
- Geo-loc analyses: Frequent location
Enter the number of results you want displayed for the following analyses:
- Call analyses: Frequent numbers, Frequent sectors, First-Last sectors, Sector by hour, Common numbers, Idle sectors, Frequent IP and Common IP.
- Geo-loc analyses: Frequent location
Select only if you want to include the country code in the analyses results. Normally this is not required but it can be useful if your case includes international phone numbers, for example if you are analyzing drug cases with international cartel contacts, as it allows you to quickly identify the country of the phone while you are viewing the analyses.
Select to to hide the associate names which provides privacy to the associate if you need to share the analysis details with others.
Select to exclude shorter numbers that are likely not to be of interest to you such as SMS or voice call from the operator, and ATM bank transactions.
Select to exclude phones which your administrator has set with a type/category that they identified as not being of interest in your analyses, for example phones on the white list. This means that the phones listed are focused on those which are of most interested to you.
By default calls without a matching tower location are included in the Calls by hour analysis. Clear this setting if you only want calls with matching tower locations included in the Calls by hour analysis.
Set the time interval you want to use for the Common location-time and Location with common location-time call analyses, and the Common location-time geo-location analysis.
Set the maximum distance apart that cells or geo-location events can be for them to be included as being in the same area for the Common location-time and Location with common location-time call analyses, and the Common location-time geo-location analysis.
Enter the bin size of the area you want to use for the Frequent location geo-location, Person's device at location, Location with person's device, Common location-time, Frequent sector and Sector by hour analyses. For the Frequent location geo-location, each grid OSS-ESPA creates is named "GL<n>" and this is used to group the results on the Geo-loc analyses tab.
Default: 500 square meters
Select only if you want to include the handover data in the Person's device at location, Location with person's device, Common location-time, Frequent sector and Sector by hour analyses. By default this is selected but you may wish to not include handover data if there is too much data that it makes it difficult for you to analyze the results, or if it causes OSS-ESPA memory performance issues.
Select only if you want to include the TA data in the Person's device at location, Location with person's device, Common location-time, Frequent sector and Sector by hour analyses. By default this is selected but you may wish to not include TA data if there is too much data that it makes it difficult for you to analyze the results, or if it causes OSS-ESPA memory performance issues.
Select which types of calls you want included in the Sector by hour analysis.
Enter the number of hours you want to define as the idle time before the result is included in the Idle sectors analysis. For example, if you enter 4 hours then only when there has been no phone activity for 4 hours while the phone is in the same sector will the result be displayed in the analysis.
The Target summary view can display a lot of data, therefore it is important to load only the data that you are interested in which helps improve the performance of the ESPA analysis center. If you are not using the Target summary view then you should ensure that none of the options are selected.
Person device at location and Common-location-time are the outputs from the Call analyses tab's Person's device at location and Common location-time.
TA, Call location group and HO location group are the outputs generated from Include TA call locations in location analyses and Include HO in location analyses.
The remaining record options are those from the uploaded case files.
These settings determine which call and geo-loc analyses are by default selected to run each time you click Refresh on the Input and settings view, however you can override these settings using the Settings & Analyses section of the Input and settings view. These are the analyses that are displayed on the Call analyses tab and the Geo-loc analyses tab tabs. To optimize the performance of the ESPA analysis center it is recommended that you only select the analyses that you are planning to use. Once your data has loaded you can also run analyses individually using  or
or  on the Call analyses and Geo-loc analyses tabs and on the Settings & Analyses section of the Input and settings view.
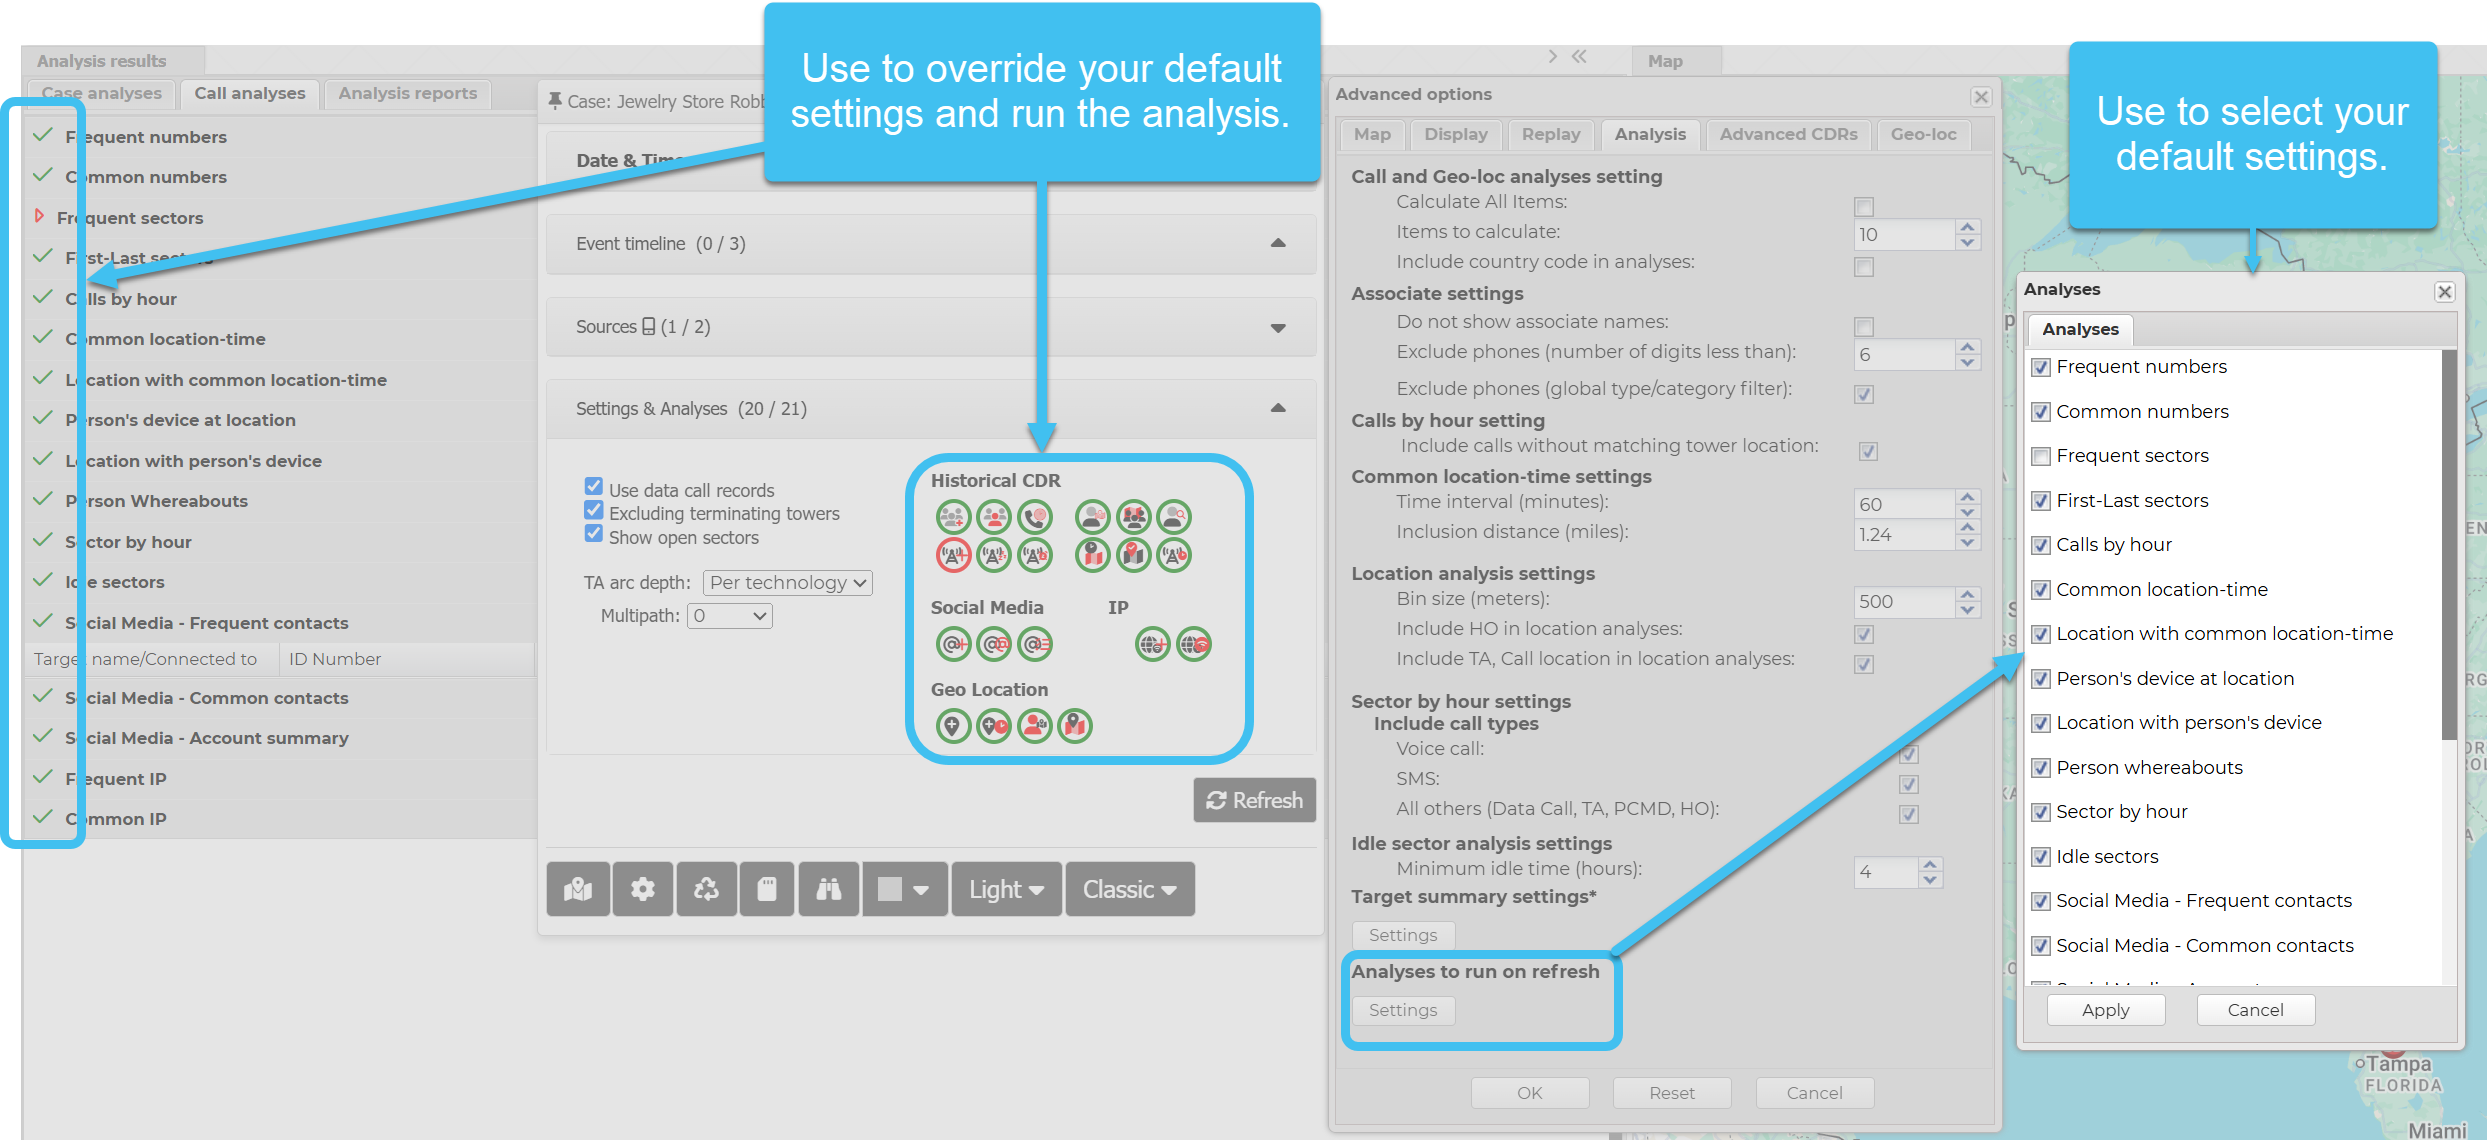
Click to apply any changes you have made. The dialog box closes automatically. Note, any changes to the settings on this tab require you to click Refresh or Refresh data to update the results displayed in the analyses.
Click to reset all the default settings specified by your system administrator. This resets all the settings on all tabs.
Click to close the dialog box without applying any changes you may have made.
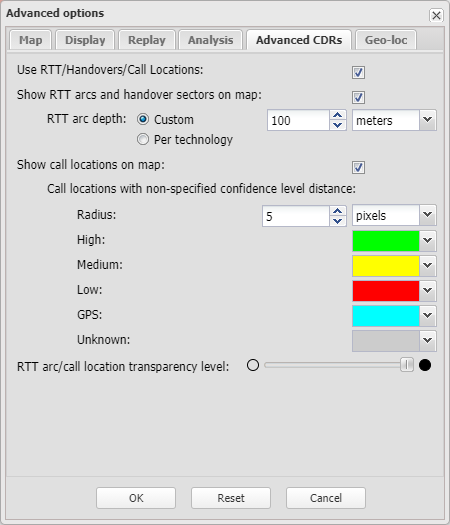
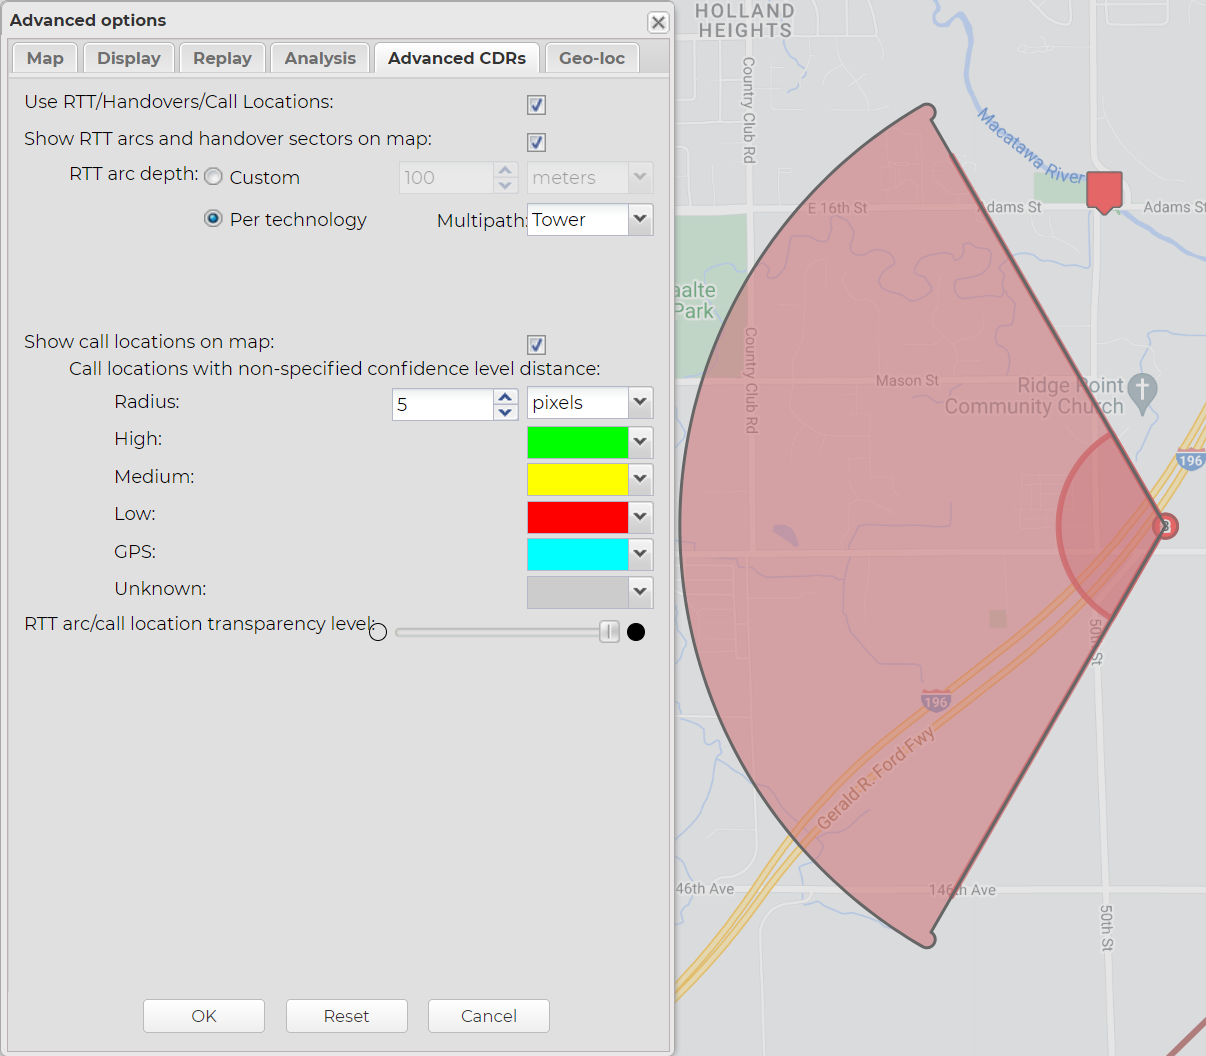
This feature requires option E7 Advanced CDRs. If you do not have this option this tab is not available.
Select to display the estimated call location, TA arc and handover data on the ESPA analysis center screen. When this setting is selected:
- Call loc zoom, Call loc and Conf columns are displayed on the CDR data tab if a phone number is selected that has a CDR file uploaded that contains estimated call locations. A call locations map layer is also displayed.
- A TA data tab is displayed at the bottom-right of the ESPA analysis center screen if a phone number is selected that has a TA CDR file uploaded. An TA map layer is also displayed.
- An HO data tab is displayed at the bottom-right of the ESPA analysis center screen if a phone number is selected that has a CDR file uploaded that contains handovers. A handovers map layer is also displayed.
In most situations you would have this setting selected, however you may want to unselect it you are not currently using the data and the case contains a large amount of advanced CDR data that is slowing down the performance of the ESPA analysis center.
Select to display the map layers for the TA arcs and the handover sectors. These layers are only available if a phone number is selected that has a CDR file uploaded that contains these features.
Use to set the default depth of the TA arcs when they are displayed on the map. You can either set to display:
-
Custom: using a custom default value and enter the value in meters and then select the units you want used. Typically you will not change this setting, however it may be useful to set it differently if you are trying to identify possible locations in conjunction with other TA arcs and estimated call locations.
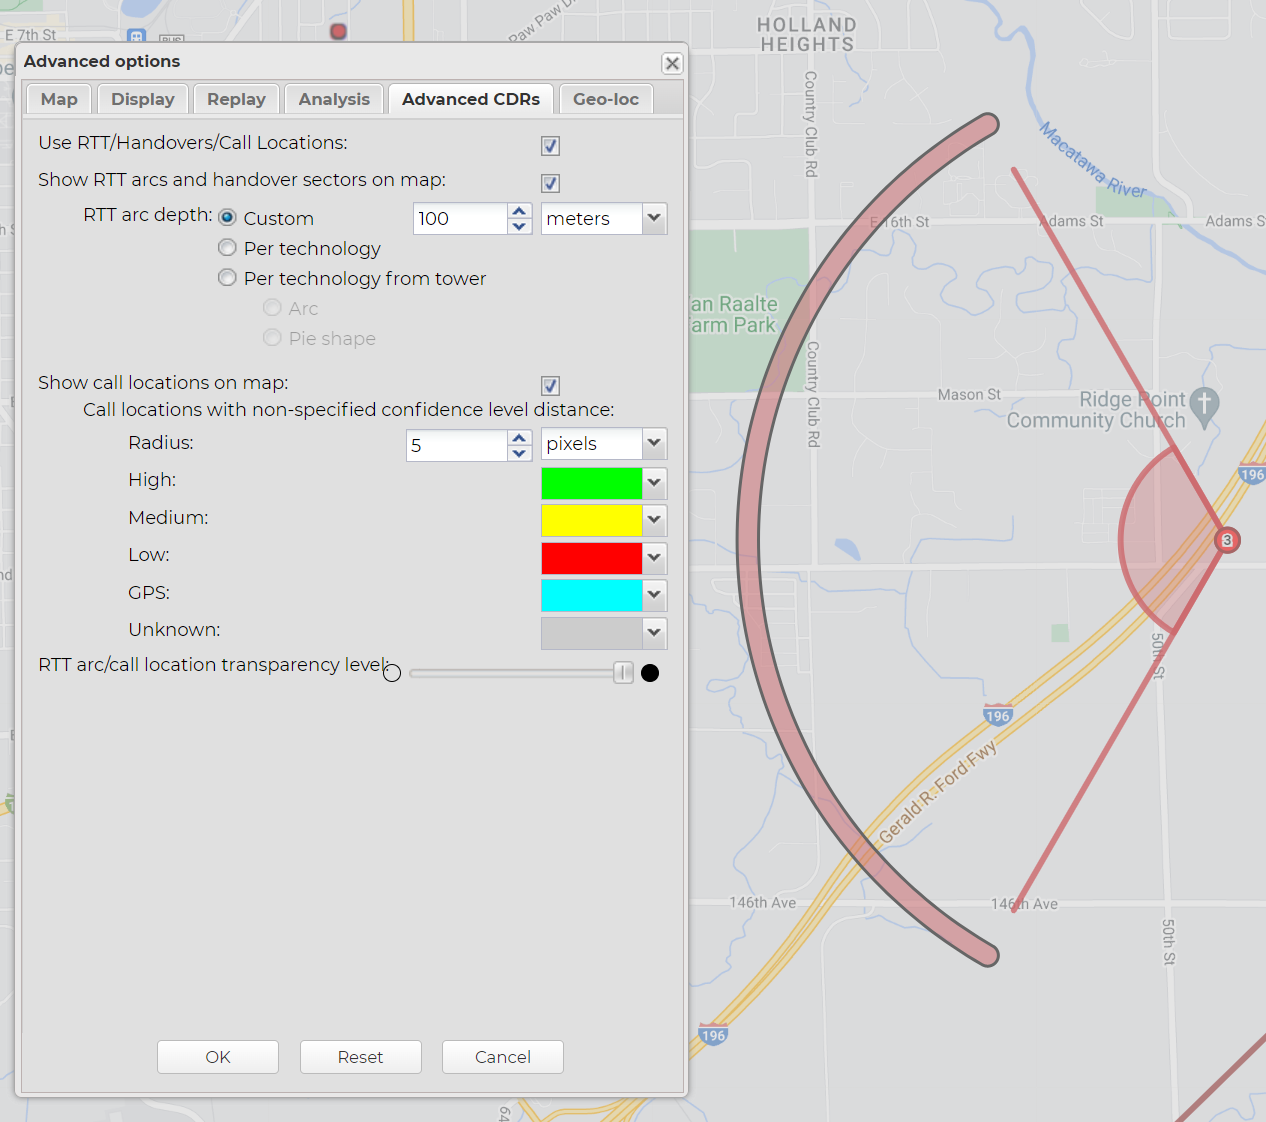
-
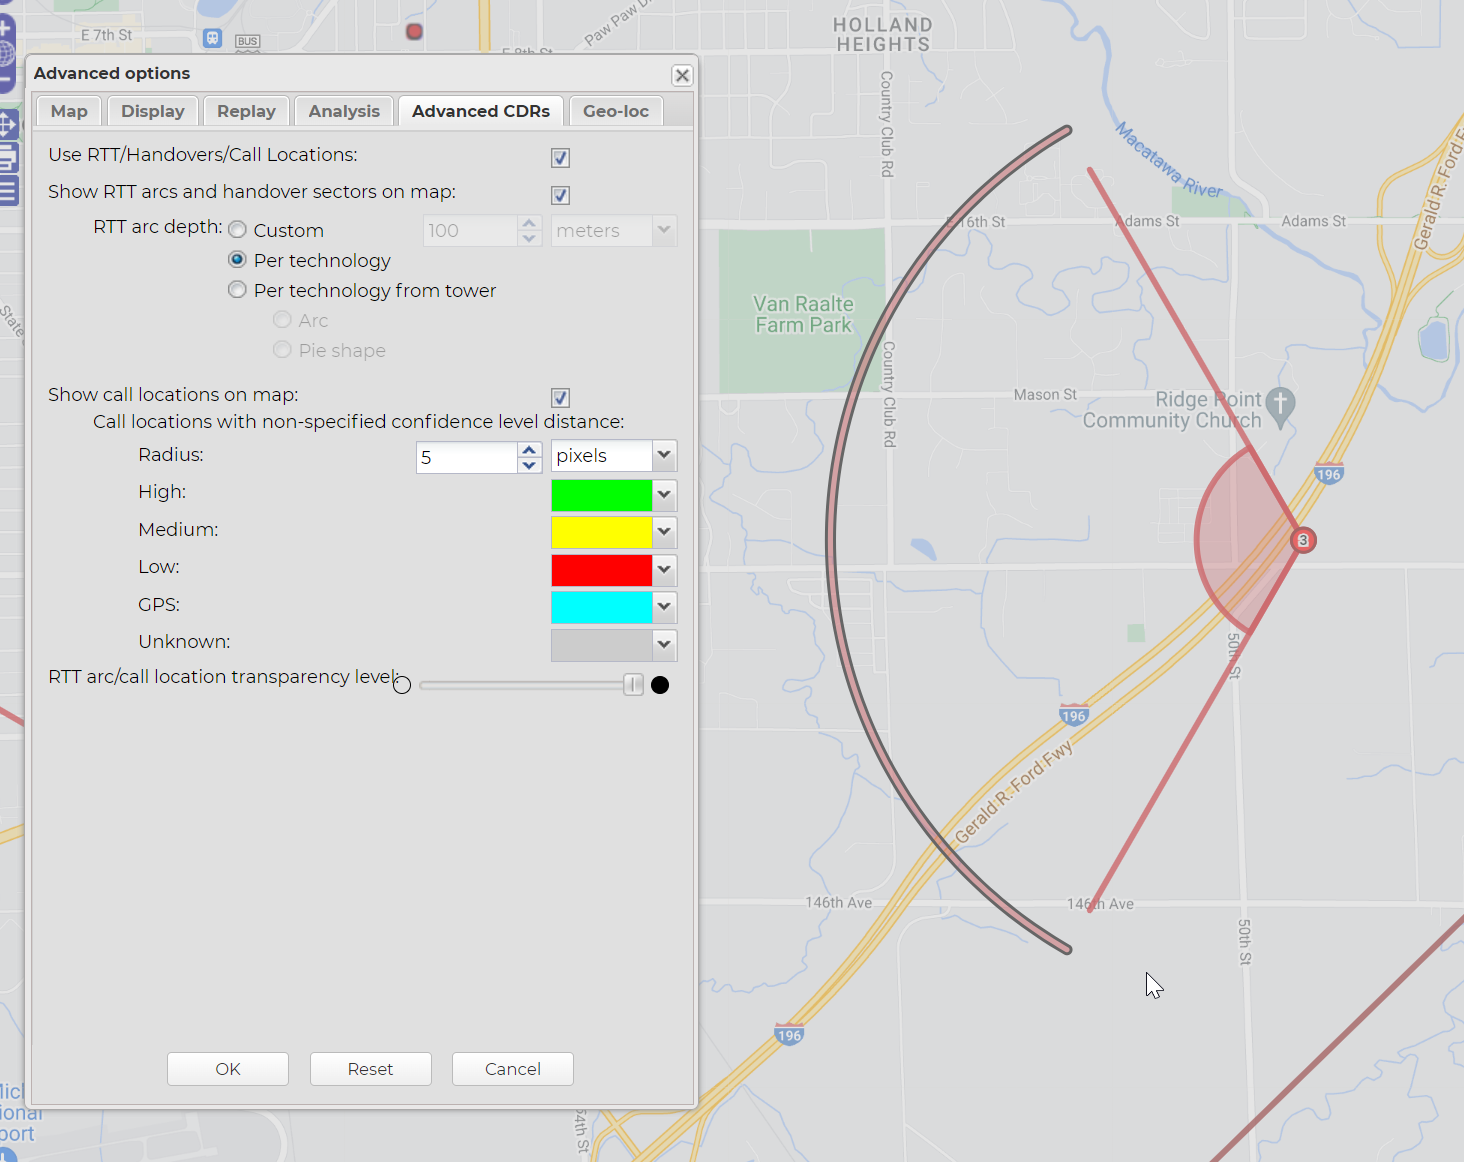
Per technology: based on the depth defined by their technology, that is:
-
LTE: 78 m. Therefore if you wanted to replicate the technology using the Custom setting you should enter this value.
-
CDMA: 244 m
-
GSM: 450 m
-
UMTS: 234 m
-
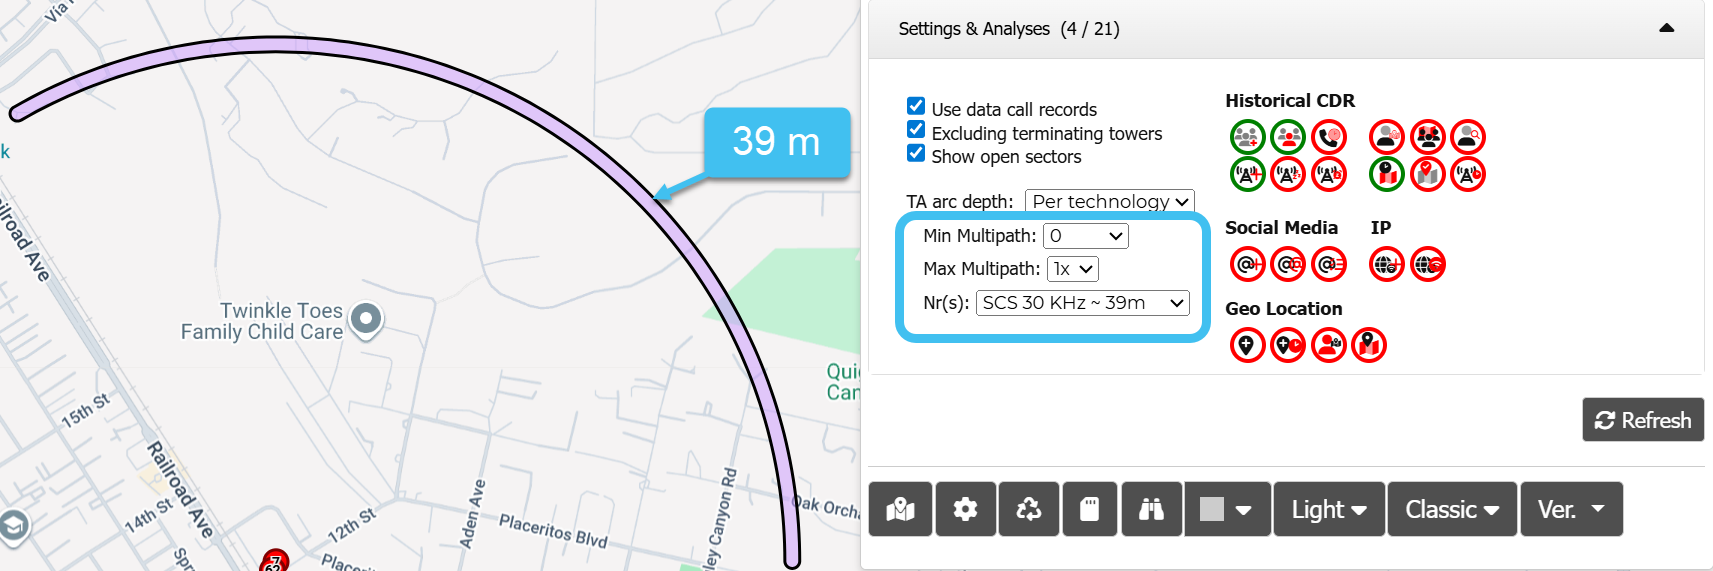
NR: uses the value set in the NR(s) setting.
The Per technology option is used by default.
-
-
Min Multipath and Max Multipath: If you want to know the theoretical minimum and maximum distance for the timing advance use these settings as they consider multipath scenarios. The TA arc can then be displayed on the map using different methods. Which you select is dependent on your organization's preferences.
The minimum distance changes with each setting as follows:
-
0: the minimum distance = distance. This is the default.
-
-1x: the minimum distance = distance - (1 x technology depth).
-
-2x: the minimum distance = distance - (2 x technology depth).
-
Tower: displays as a pie shape with no minimum distance.
The maximum distance changes with each setting as follows:
-
1x: the maximum distance = distance + (1 x technology depth). This is the default.
-
2x: the maximum distance = distance + (2 x technology depth).
-
-
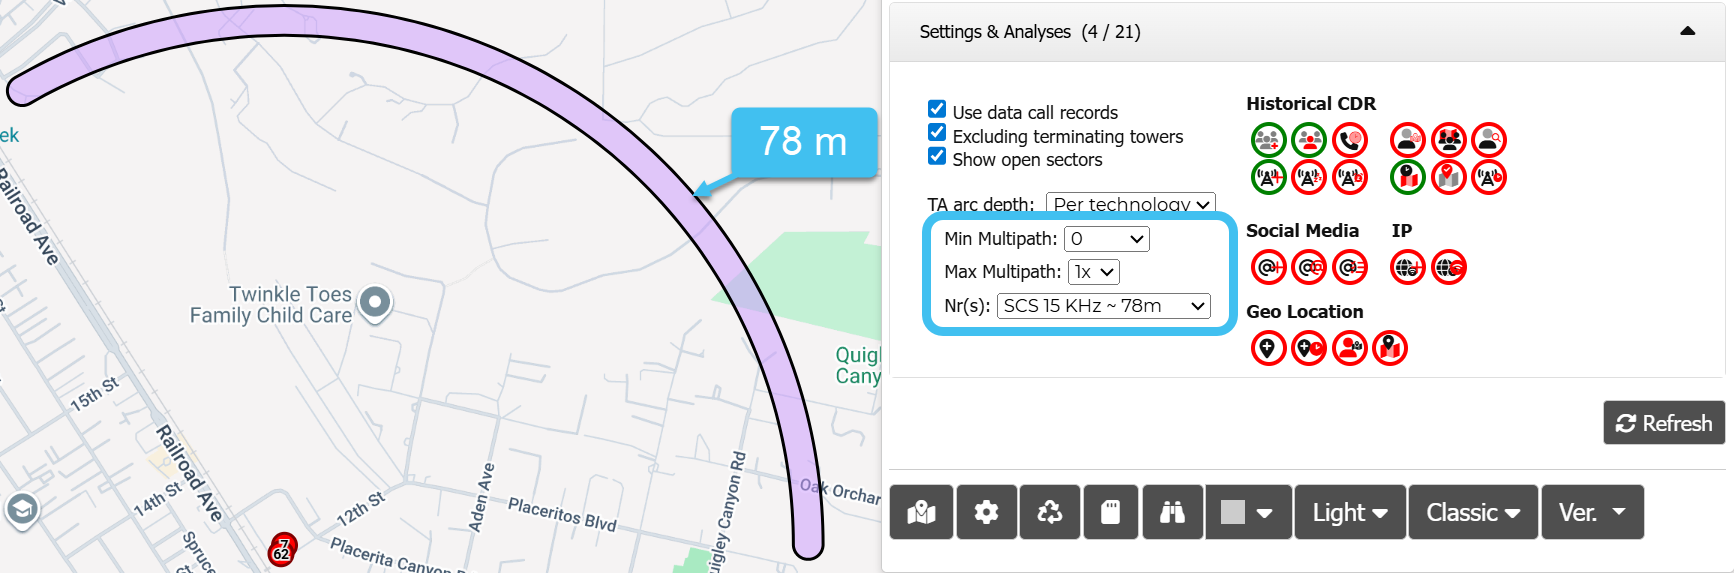
NR(s): for 5G NR (New Radio) the arc depth is based on the subcarrier spacing (SCS). The default is set to SCS 15 kHz which is 78 meters. The other arc depths are: SCS 30 kHz is 39 m, SCS 60 kHz is 19.5 m, SCS 120 kHz is 9.8 m and SCS 240 kHz is 4.8 m.
The following three graphics, which are of the NR technology, give examples of how these settings display:

If you change this value when you have TA arcs already displayed on the map they are all automatically updated to the new value unless you have set an individual arc property. An individual arc property is set by right-clicking the arc and setting a value on the TA arc properties dialog box.
Select to display the map layer for the estimated call locations and to display the Call loc zoom, Call loc and Conf columns on the CDR data tab. This map layer is only available if a phone number is selected that has a CDR uploaded that contains estimated call locations, for example ATT LocDBoR. This allows you to view the call's estimated location.
Use these settings to select how the estimated call locations are displayed on the map by default. These settings are only applicable if the CDR file does not specify the confidence level as an exact distance but instead provides low, medium, high and unknown.
Use Radius to enter the value and then select the units you want to use. This radius setting applies to the radius of the low, medium and high estimated call locations. If you change this value when you have estimated call locations already displayed on the map they are all automatically updated to the new value unless you have set an individual call location property. An individual call location property is set by right-clicking the call location on the map, selecting Call location properties... and setting a value on the Call location properties dialog box.
Use Low, Medium, High and Unknown to select the color you want to identify the confidence level of the estimated call locations on the map. These color settings apply only to the low, medium and high estimated call locations, and not those which provide an exact distance.
Typically you will not change these settings, however it may be useful to set the radius higher than the default if you are zoomed-out of the map and you want to make the call locations more visible.
Use the slider to change the default transparency level used to display the TA arcs and estimated call locations on the map. Reducing the transparency level is useful if you have multiple highlighted items on the map overlapping each other as it makes it easier to read the underlying map layers and street names.
Note, you can also change the transparency level on an individual basis. For further information refer to either How to change an individual TA arc's properties or How to change the transparency level of an individual estimated call location. Any TA arcs or call locations which you have set an individual transparency level on are displayed with a combination of this default transparency level and the individual level. For example if the default setting is set to 50% and the individual setting is set to 50% the overall transparency is displayed as 25%.
Click to apply any changes you have made. The dialog box closes automatically.
Click to reset all the default settings specified by your system administrator. This resets all the settings on all tabs.
Click to close the dialog box without applying any changes you may have made.
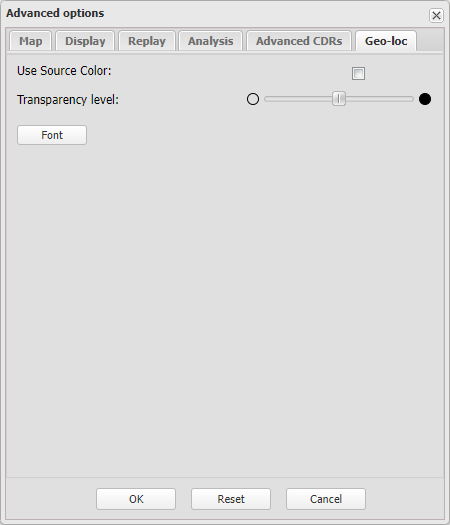
Select if you want the color of the geo-location icon to match the color of the source of the geo-location data.
Use the slider to change the default transparency level used to display the confidence radius of the geo-location data. Reducing the transparency level is useful if you have multiple highlighted items on the map overlapping each other as it makes it easier to read the underlying map layers and street names.
Click to edit how the geo-location information is displayed in the geo-location pop-ups. The Geo Location information font dialog box opens.
Click to apply any changes you have made. The dialog box closes automatically.
Click to reset all the default settings specified by your system administrator. This resets all the settings on all tabs.
Click to close the dialog box without applying any changes you may have made.